


Category: Found on the Internet
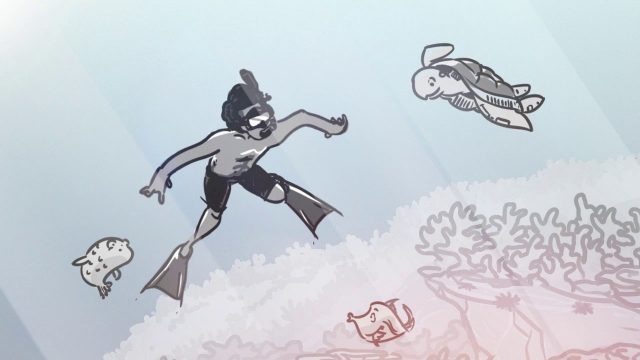
The Coral Reef Economy Is Bigger Than You Think
0 Views0 Comments0 Likes
Did you know coral reefs pump more than $3.4 billion into the U.S. economy annually? Learn how healthy coral reef ecosystems do everything from supporting millions of jobs to protecting lives and coastal infrastructure--like hotels, roads and bridges.
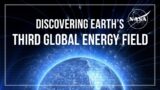
The Geocenter of the Earth Is Changing (And Why That Matters)
0 Views0 Comments0 Likes
At the foundation of virtually all airborne, space-based and ground-based Earth observations is the TRF, or Terrestrial Reference Frame.

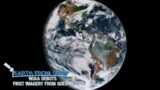
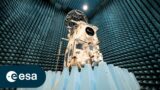
The Global Sensor Network – University of South Australia
0 Views0 Comments0 Likes
Australia has a combined land and sea territory of more than 8 million square kilometers. Yet most of this is currently out of the reach of affordable communication. Now the University of South Australia's Institute for Telecommunications Research has turned this on its head, with the development of the Global Sensor Network. The Global Sensor Network is an innovative signal processing system which provides low cost, two-way, simultaeneous satellite communications to multiple users.
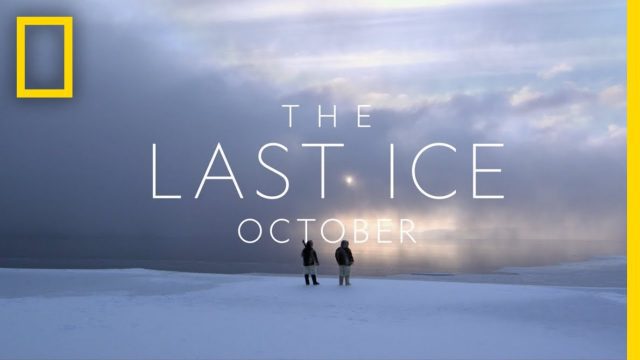
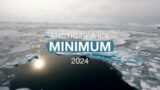
The Last Ice Trailer
0 Views0 Comments0 Likes
THE LAST ICE tells the story of the Inuit communities fighting to protect the disappearing Arctic that has been their home for centuries. From National Geographic Pristine Seas, THE LAST ICE premieres on National Geographic Channel this October.
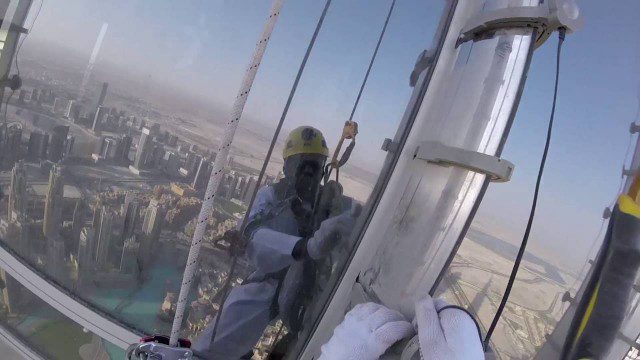
The LED Exterior Facade of Burj Khalifa Uncovered
0 Views0 Comments0 Likes
Facts uncovered by a dedicated team of specialized engineers. All you need to know about the largest LED screen in the world covering the world's tallest tower's facade.
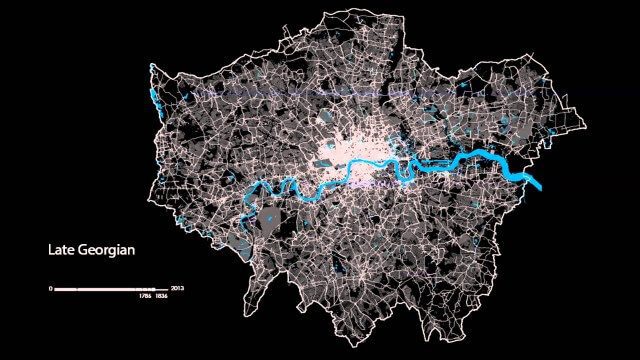
The London Evolution Animation
0 Views0 Comments0 Likes
The London Evolution Animation (LEA) shows the historical development of London from Roman times to today, using georeferenced road network data brought together for the first time. The animation also visualizes (as enlarging yellow points) the position and number of statutorily protected buildings and structures built during each period.
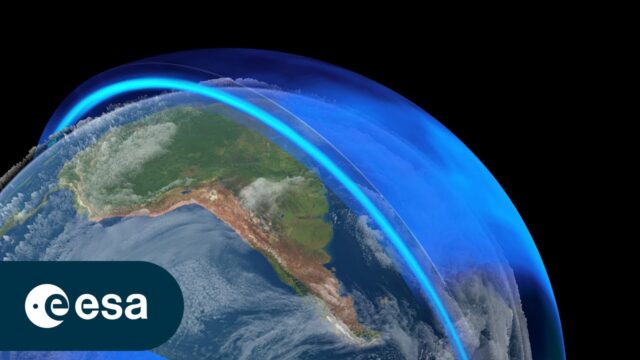
The Ozone Layer: A Hole New World
0 Views0 Comments0 Likes
In the 1980s, scientists discovered a gaping hole in Earth's ozone layer, caused by humanmade chemicals. But thanks to the historical Montreal Protocol, the world came together to take bold action to save our planet. ...
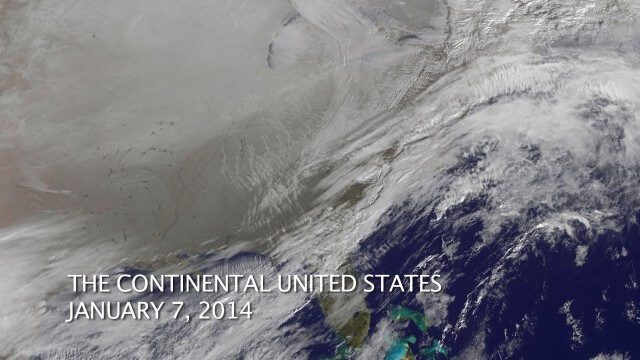
The Polar Vortex Explained in 2 Minutes
0 Views0 Comments0 Likes
The Rise of Elevation Data – What Is a DEM and Which Solution Is Best for You?
0 Views0 Comments0 Likes
The world exists in three dimensions and often, so does satellite imagery. But with so many types of Digital Elevation Models, each created via different collection and processing methods and sold in a variety of for...
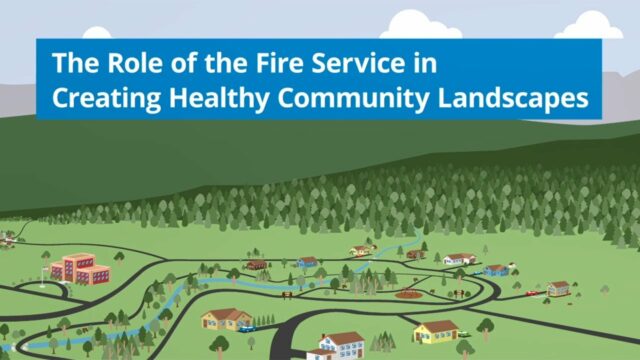
The Role of the Fire Service in Creating Healthy Community Landscapes
0 Views0 Comments0 Likes
The Wildland-Urban Interface is the zone of transition between unoccupied land and human development. It is the line, area, or zone where structures and other human develop meet or intermingle with undeveloped wildlan...