
Tag: video
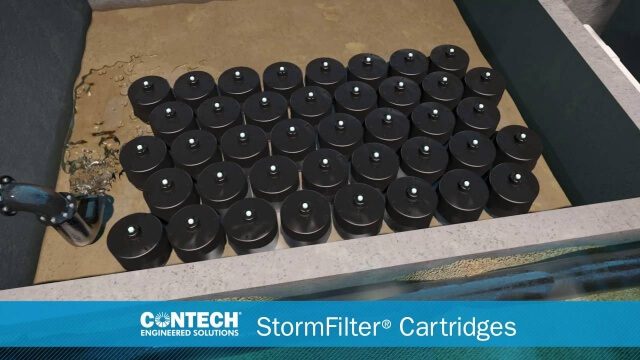
St. Anthony Regional Stormwater Treatment and Research System
0 Views0 Comments0 Likes
An estimated 169 million gallons of polluted stormwater runoff will be captured and treated each year by this underground facility on the border of Minneapolis and St. Anthony Village. It is projected to cut pollution levels by more than half for stormwater runoff flowing from the southern half of St. Anthony Village to the Mississippi River. Learn more at http://mwmo.org/sav
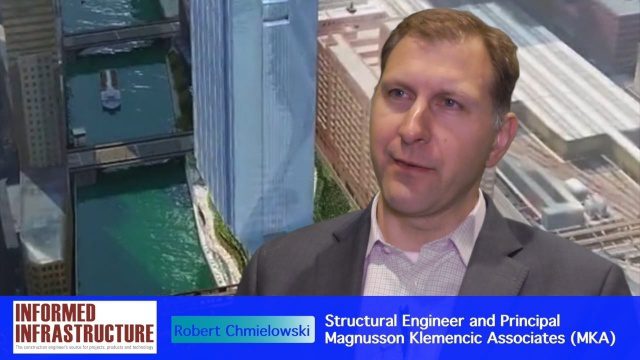
Structural Engineering of Chicago’s 150 N. Riverside Building
0 Views0 Comments0 Likes
The V1 Video team interviewed Robert Chmielowski, Structural Engineer and Principal at Magnusson Klemencic Associates (MKA), at the 2016 NASCC: The Steel Conference, held April 13-15 in Orlando, Fla. He discusses the complexities of the unique building being developed at 150 N. Riverside along the Chicago River, which include the site's strong and narrow core, the steel used to make it possible, and the software used to design and analyze the building.
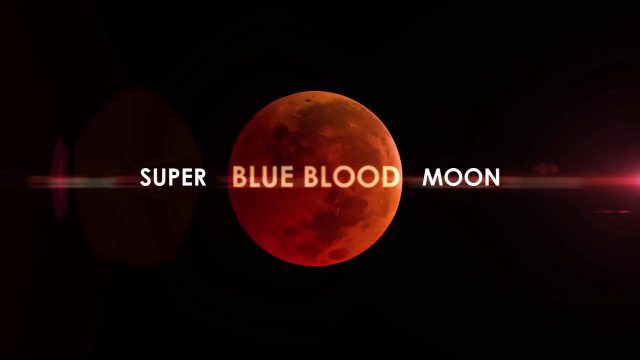
Super Blue Blood Moon and Lunar Eclipse
0 Views0 Comments0 Likes
Jan. 31, 2018, brought a lunar trifecta: the super blue blood Moon! Starting at 5:30 a.m. Eastern, NASA TV offered a livestream of the Moon. This full moon is the third in a series of “supermoons,” when the Moon is closer to Earth in its orbit -- known as perigee -- and about 14 percent brighter than usual.
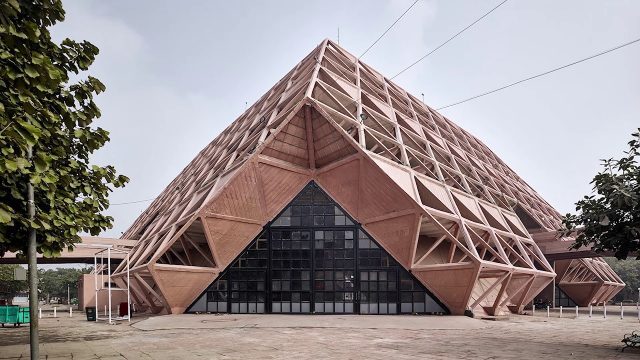
The 2018 World Monuments Watch
0 Views0 Comments0 Likes
Every two years, the World Monuments Watch issues a call to action for treasured cultural sites around the globe. Since 1996, when the Watch was founded with support from American Express, it has recognized 790 sites that face daunting threats or present compelling conservation opportunities, and it has catalyzed over $240 million of investment in their protection and conservation. The 2018 Watch brings attention to 25 sites facing diverse threats.
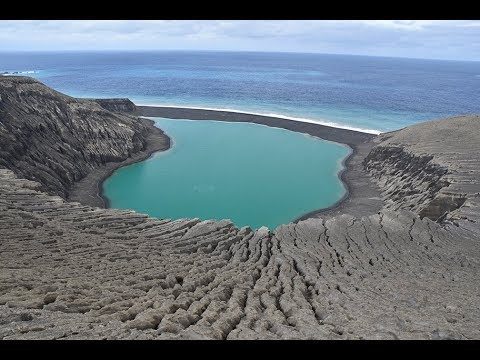
The Birth of a New Island
0 Views0 Comments0 Likes
The newly formed Tongan island, unofficially known as Hunga Tonga-Hunga Ha'apai after its neighbors, was initially projected to last a few months. Now it has a 6- to 30-year lease on life, according to a new NASA study.
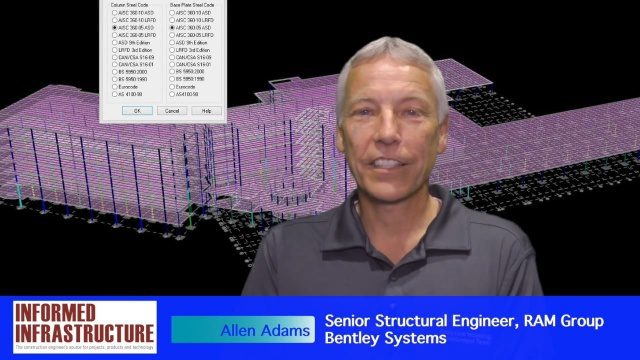
The Challenges and Benefits of Interoperability
0 Views0 Comments0 Likes
The V1 Video team interviewed Allen Adams, Senior Structural Engineer, RAM Group, Bentley Systems, at the 2016 NASCC: The Steel Conference, held April 13-15 in Orlando, Fla. He discusses the major challenges of interoperability in the infrastructure industry, Bentley Systems' approach to these difficulties, what it looks like when data isn't open to others within an organization, and how Bentley software saves its clients time and money.
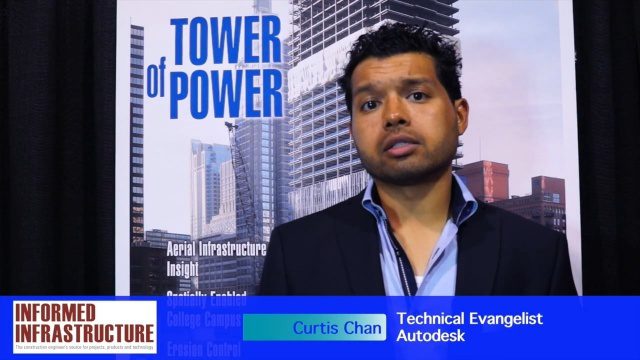
The Future of Making Things at Autodesk and Industrywide
0 Views0 Comments0 Likes
The V1 Video team interviewed Curtis Chan, Technical Evangelist at Autodesk, at the 2016 SPAR 3D Expo and Conference, held April 11-14 in The Woodlands, Texas. A keynote speaker at the event, he discusses "the future of making things" at Autodesk and through the industry; Autodesk's creative platforms such as Fusion, Spark and Forge; interesting use cases that have caught his attention; and how 3D printing can be scaled up into construction projects.
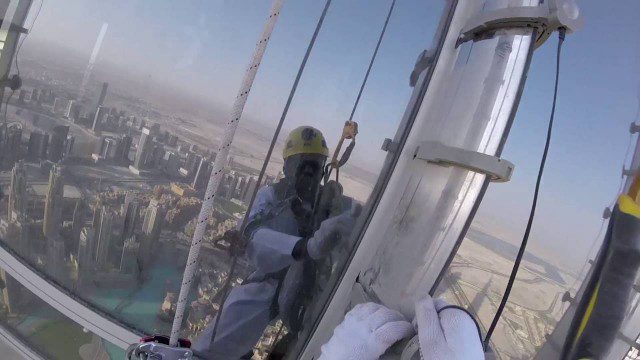
The LED Exterior Facade of Burj Khalifa Uncovered
0 Views0 Comments0 Likes
Facts uncovered by a dedicated team of specialized engineers. All you need to know about the largest LED screen in the world covering the world's tallest tower's facade.
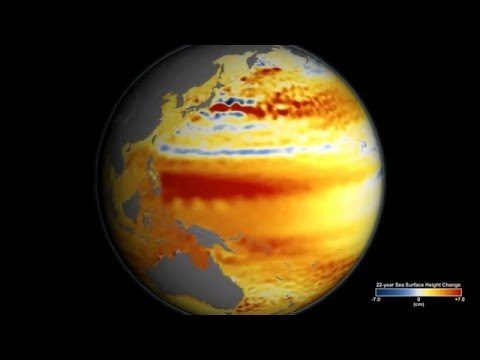
TOPEX/JASON Sees 22-Year Sea Level Rise
0 Views0 Comments0 Likes
This visualization shows total sea level change between 1992 and 2014, based on data collected from the TOPEX/Poseidon, Jason-1, and Jason-2 satellites. Blue regions are where sea level has gone down, and orange/red regions are where sea level has gone up. Since 1992, seas around the world have risen an average of nearly 3 inches. The color range for this visualization is -7 cm to +7 cm (-2.76 inches to +2.76 inches), though measured data extends above and below 7cm(2.76 inches). This particular range was chosen to highlight variations in sea level change. Download the visualization: http://svs.gsfc.nasa.gov/cgi-bin/deta....