
Tag: video
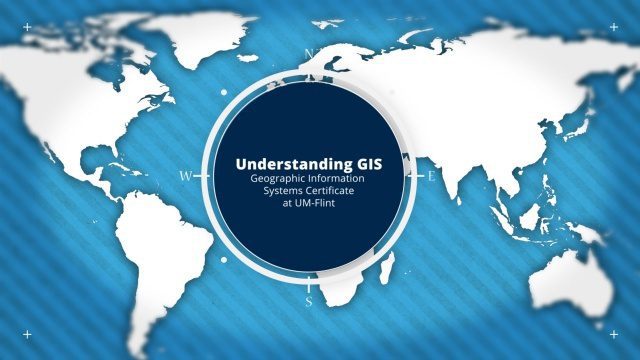
Understanding GIS – An Overview
1.55K Views0 Comments0 Likes
Geographic Information Systems are used by professionals and academics all over the world to investigate problems ranging from the spread of disease to the damage caused by hurricanes. Learn more about the University of Michigan-Flint's GIS Certificate by visiting umflint.edu/gis/gis-center
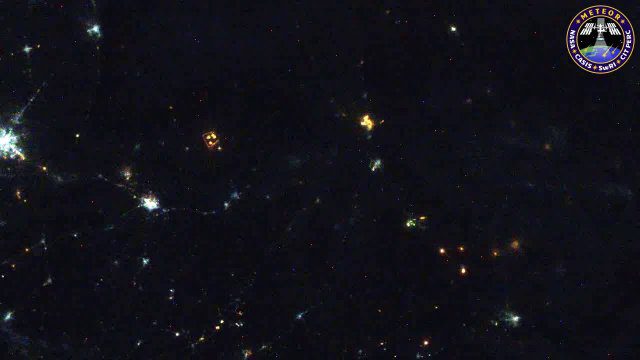
Meteors Encountering Earth’s Atmosphere
1.54K Views0 Comments0 Likes
This video was acquired August 10, 2016, with a high-resolution video camera onboard the International Space Station (ISS). Within the span of about 10 seconds, two meteors associated with the Perseid meteor shower streak across the sky above Pakistan. Video was provided by Tomoko Arai/Japan’s Planetary Exploration Research Center/Meteor Composition Determination (Meteor) investigation.

Google Geospatial Technologist Talks Trends
1.53K Views0 Comments0 Likes
INTERGEO TV interviews Ed Parsons, geospatial technologist at Google, about his thoughts on the future of the map and related technology.
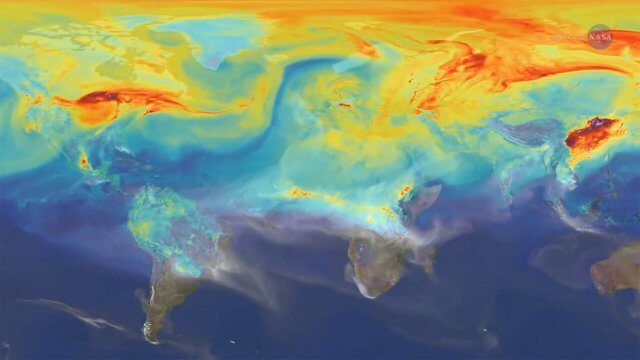
Reshuffling Heat on a Warming Planet
1.51K Views0 Comments0 Likes
Earth's oceans could be concealing a mystery about climate change. Researchers have recently found evidence of hidden heat hundreds of meters below the ocean's surface.
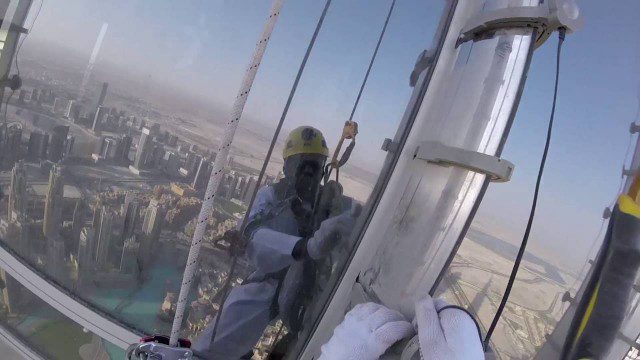
The LED Exterior Facade of Burj Khalifa Uncovered
1.50K Views0 Comments0 Likes
Facts uncovered by a dedicated team of specialized engineers. All you need to know about the largest LED screen in the world covering the world's tallest tower's facade.
SmallSats are the Next Big Thing
1.49K Views0 Comments0 Likes
NASA is about to launch six new next-generation Earth-observing small satellites — some as small as a loaf of bread. These tiny spacecraft are helping to foster creative and cost-effective approaches to studying our planet.

Destination Low Earth Orbit
1.45K Views0 Comments0 Likes
ESA astronaut Andreas Mogensen narrates this video on the inspiring endeavours of human spaceflight and how it changes our daily lives.
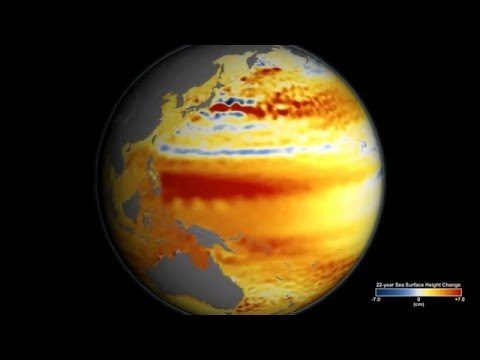
TOPEX/JASON Sees 22-Year Sea Level Rise
1.45K Views0 Comments0 Likes
This visualization shows total sea level change between 1992 and 2014, based on data collected from the TOPEX/Poseidon, Jason-1, and Jason-2 satellites. Blue regions are where sea level has gone down, and orange/red regions are where sea level has gone up. Since 1992, seas around the world have risen an average of nearly 3 inches. The color range for this visualization is -7 cm to +7 cm (-2.76 inches to +2.76 inches), though measured data extends above and below 7cm(2.76 inches). This particular range was chosen to highlight variations in sea level change. Download the visualization: http://svs.gsfc.nasa.gov/cgi-bin/deta....

NASA Sees Intense Fires around the World
1.43K Views0 Comments0 Likes
This year’s wildfire season is off to a blazing start. The United States had an early start to the season, with more than 29,000 wildfires burning more than 2.6 million acres of land. The driest season in 14 years has left the southern Amazon primed for heavy wildfire activity as well.

Proposed Bus Terminal in NYC
1.39K Views0 Comments0 Likes
Pelli Clarke Pelli Architects proposed a relatively compact terminal to be built exclusively on Port Authority-owned land just west of the current facility between West 38th and West 40th streets that would cost $3.7 billion to construct.