Tag: NASA
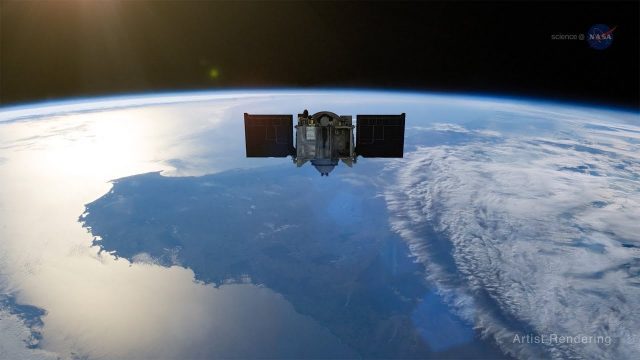
ScienceCasts: Riding the Slingshot to Bennu
0 Views0 Comments0 Likes
Gravity’s pull is being used to help propel a small spacecraft known as OSIRIS-REx to a near-Earth asteroid called Bennu.
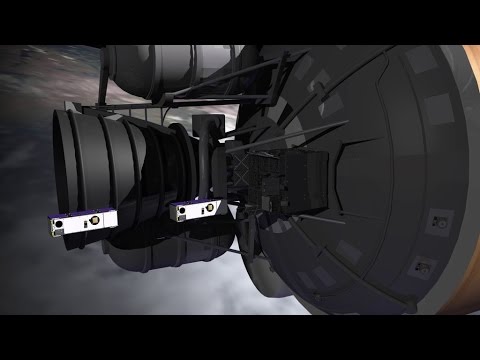
SmallSats are the Next Big Thing
0 Views0 Comments0 Likes
NASA is about to launch six new next-generation Earth-observing small satellites — some as small as a loaf of bread. These tiny spacecraft are helping to foster creative and cost-effective approaches to studying our planet.
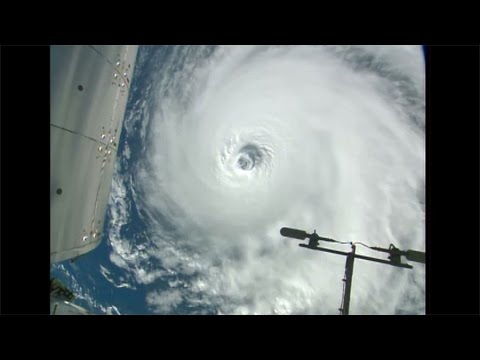
Space Station Orbits Three Hurricanes
0 Views0 Comments0 Likes
Cameras outside the International Space Station, 257 miles above Earth, captured spectacular views on Aug. 30, 2016, of three powerful tropical systems churning across the Pacific and Atlantic Oceans.
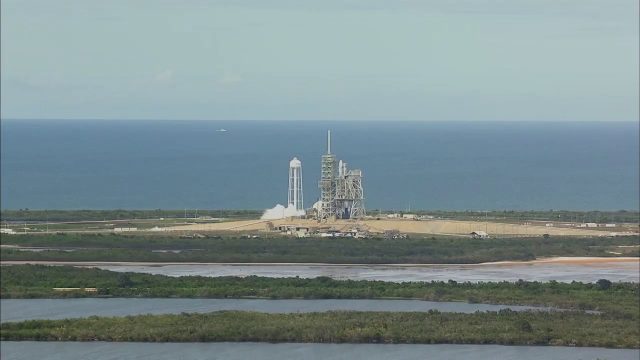
SpaceX CRS-11 Liftoff for International Space Station
0 Views0 Comments0 Likes
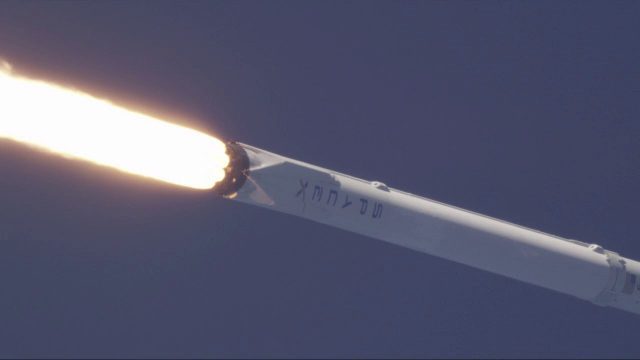
The SpaceX CRS-11 Falcon 9 rocket lifts off from Launch Complex 39A at NASA's Kennedy Space Center sending a Dragon spacecraft on the company's 11th commercial resupply services mission to the International Space Station. Liftoff was at 5:07 p.m. EDT on June 3, 2017.
SpaceX Falcon 9 Liftoff with TESS
0 Views0 Comments0 Likes
A Falcon 9 rocket lifts off at 6:51 p.m. EDT from Space Launch Complex 40 at Cape Canaveral Air Force Station carrying NASA's Transiting Exoplanet Survey Satellite (TESS).
Super Blue Blood Moon and Lunar Eclipse
0 Views0 Comments0 Likes
Jan. 31, 2018, brought a lunar trifecta: the super blue blood Moon! Starting at 5:30 a.m. Eastern, NASA TV offered a livestream of the Moon. This full moon is the third in a series of “supermoons,” when the Moon is closer to Earth in its orbit -- known as perigee -- and about 14 percent brighter than usual.
The Birth of a New Island
0 Views0 Comments0 Likes
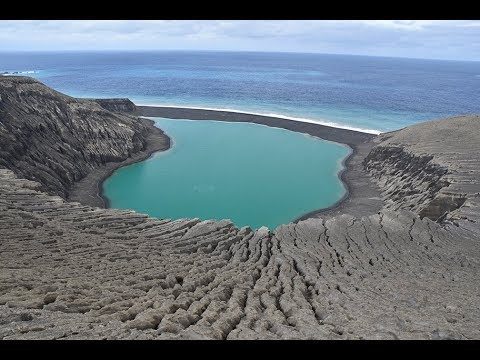
The newly formed Tongan island, unofficially known as Hunga Tonga-Hunga Ha'apai after its neighbors, was initially projected to last a few months. Now it has a 6- to 30-year lease on life, according to a new NASA study.
TOPEX/JASON Sees 22-Year Sea Level Rise
0 Views0 Comments0 Likes
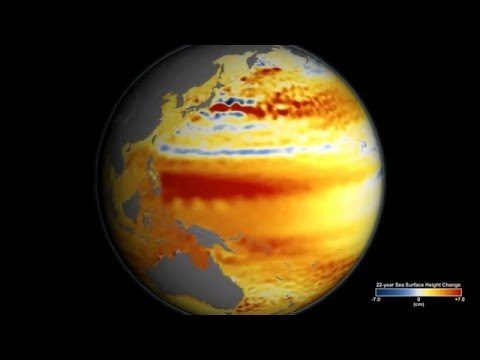
This visualization shows total sea level change between 1992 and 2014, based on data collected from the TOPEX/Poseidon, Jason-1, and Jason-2 satellites. Blue regions are where sea level has gone down, and orange/red regions are where sea level has gone up. Since 1992, seas around the world have risen an average of nearly 3 inches. The color range for this visualization is -7 cm to +7 cm (-2.76 inches to +2.76 inches), though measured data extends above and below 7cm(2.76 inches). This particular range was chosen to highlight variations in sea level change. Download the visualization: http://svs.gsfc.nasa.gov/cgi-bin/deta....
Tracking California Rains During El Niño
0 Views0 Comments0 Likes
This winter, areas across the globe experienced a shift in rain patterns due to the natural weather phenomenon known as El Niño. New NASA visualizations of rainfall data show the various changes to California. According to the National Oceanic and Atmospheric Administration, El Niño was expected to produce wetter-than-average conditions from December 2015 to February 2016. Scientists refer to historical weather patterns and to look at trends of where precipitation normally occurs during El Niño events. Also, several factors—not just El Niño—can contribute to unusual weather pattern.
Tracking Ocean Heat with Magnetic Fields
0 Views0 Comments0 Likes
Scientists at NASA’s Goddard Space Flight Center are developing a new way to use satellite observations of magnetic fields to measure heat stored in the ocean.

