
Monthly Archives: July 2014
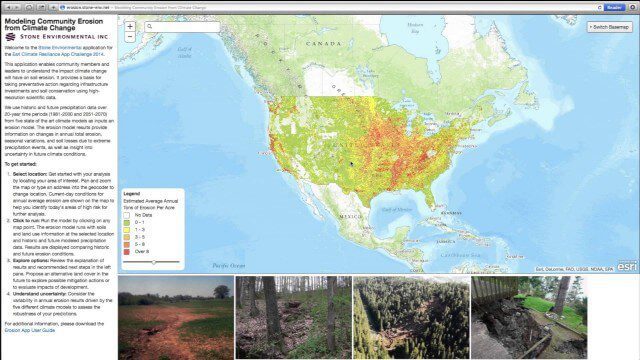
Modeling Community Erosion from Climate Change
1.53K Views0 Comments0 Likes
Based on modeling current and future soil erosion with high-resolution scientific data, the app allows users to locate sites that are vulnerable to erosion, predicts soil loss driven by climate change, and enables users to investigate erosion risks for future land covers.
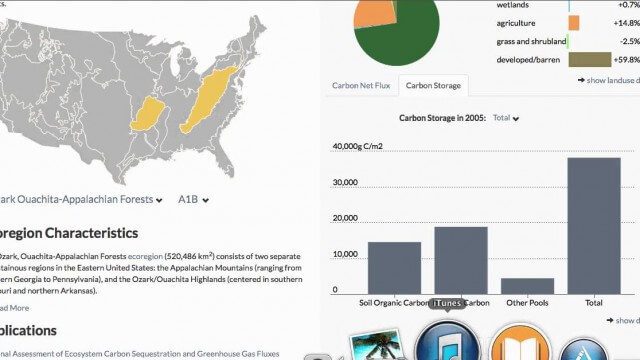
USGS LandCarbon Viewer Tutorial
1.58K Views0 Comments0 Likes
This video, narrated by USGS scientist Brad Reed, provides a brief tutorial on the use of the USGS LandCarbon Viewing tool.
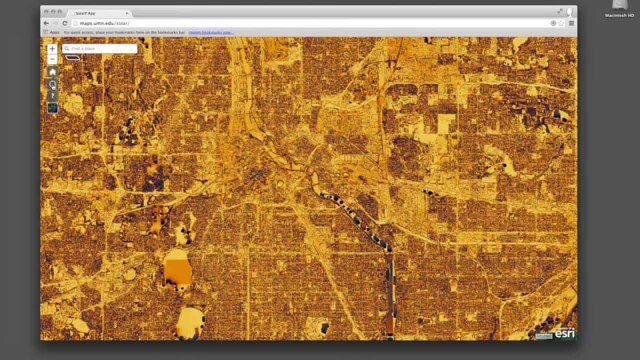
Minnesota Solar Suitability Analysis
1.67K Views0 Comments0 Likes
This app enables users to identify the suitability of a location for solar panel installations by locating their home or current location and querying solar analysis data.

OCO-2: NASA’s New Carbon Counter
1.92K Views0 Comments0 Likes
NASA's OCO-2 mission will shed new light on understanding carbon and its role in our planet's future.
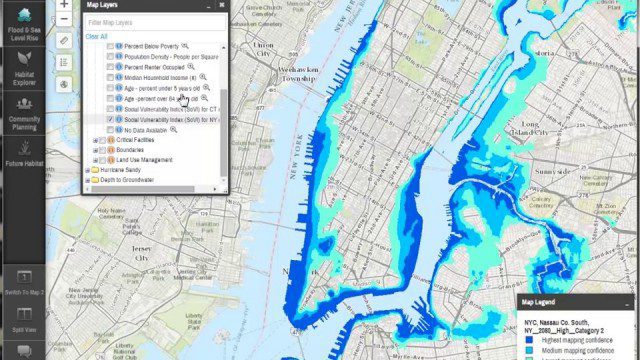
Coastal Resilience 2.0
2.12K Views0 Comments0 Likes
Providing tools to reduce ecological and socioeconomic risks of coastal hazards, the app enables users to assess such risks, including those to current and future storms, as well as sea level rise scenarios; identify solutions to reduce risks across socio-ecological systems; take action to help communities develop nature-based solutions; and measure effectiveness to ensure efforts are successful.
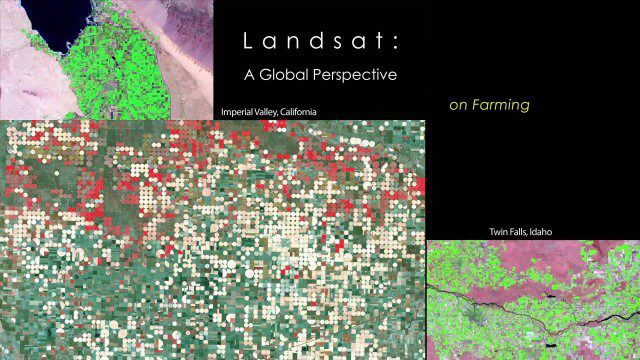
NASA | Landsat’s Global Perspective
2.14K Views0 Comments0 Likes
On July 23rd, 1972, the first Landsat spacecraft launched into orbit. At the time, it was called "Earth Resources Technology Satellite," or ERTS, and was the first satellite to use a scanning spectrophotometer. Previous satellites relied on film cameras (ejecting the exposed film to be caught by planes) or transmitted the signal from television cameras. The scanning sensor and its successor sensors on subsequent Landsat satellites revolutionized how we study our home planet. Celebrating this anniversary, this video is a "greatest hits" montage of Landsat data. Throughout the decades, Landsat satellites have given us a detailed view of the changes to Earth's land surface. By collecting data in multiple wavelength regions, including thermal infrared wavelengths, the Landsat fleet has allowed us to study natural disasters, urban change, water quality and water usage, agriculture development, glaciers and ice sheets, and forest health.
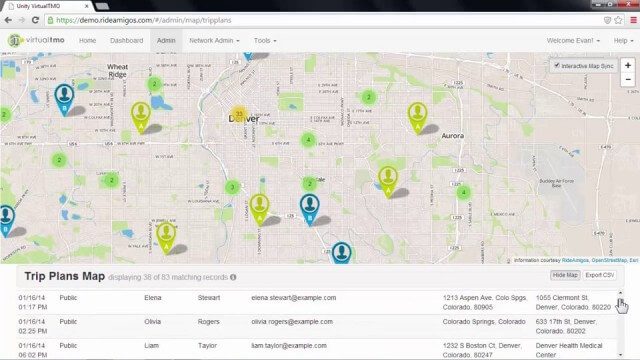
RideAmigos UNITY
2.26K Views0 Comments0 Likes
Uniting entities that create the data needed to provide rich visualizations and insights into commuter habits globally, Unity enables unlimited public and private networks within a region to create behavioral changes and eliminate traffic by allowing users to sync data to Esri ArcGIS software for modal analysis. Users can also explore how each mode contributes to greenhouse gas emissions and climate change.
Community Resilience Inference Measurement
2.27K Views0 Comments0 Likes
Measuring resilience to climate-related hazards at the county level for the United States, the app allows users to directly calculate the resilience index of places they choose and view the weights of the socioeconomic factors contributing to those scores. The app also provides factors that increase or decrease resilience.
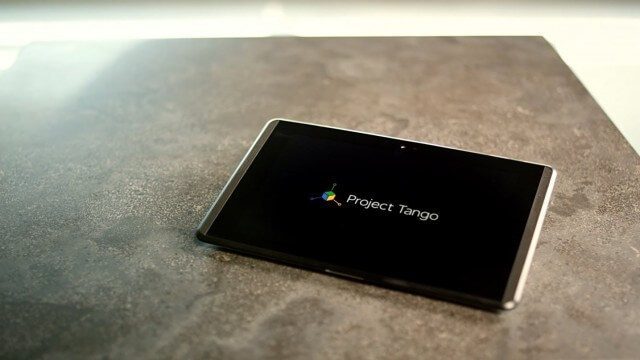
Google’s Project Tango – Journey
2.31K Views0 Comments0 Likes
Over the past 18 months, Project Tango has been collaborating with robotics laboratories from around the world to concentrate the past decade of research and computer vision into a new class of mobile device.
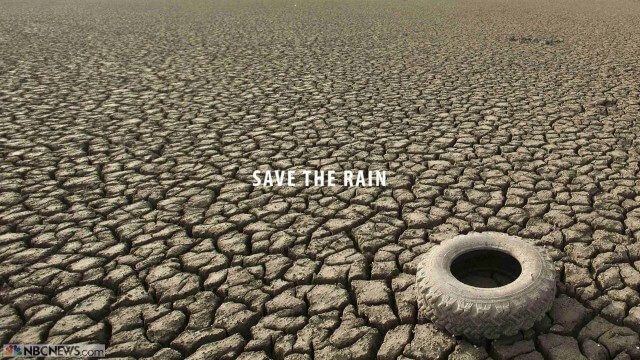
Save the Rain
2.32K Views0 Comments0 Likes
Users are able to make smarter choices and save water when it is available. The next time it rains, users can capture rainwater that lands on their homes and use it again to water plants, trees, and lawns; wash cars; and even flush toilets.