
Tag: Internet
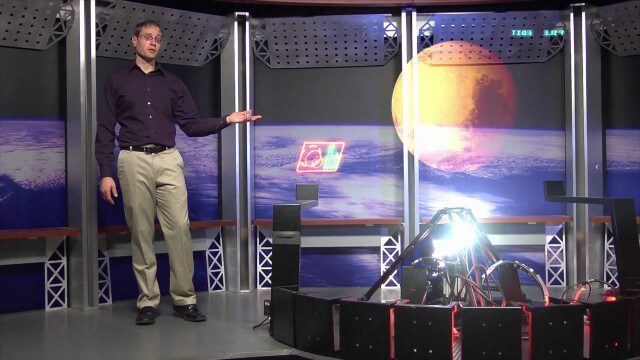
NASA Intro to LIDAR
0 Views0 Comments0 Likes
Want to know the 3D shape of terrain on another planet? Want to study the height and density of Earth's forests? An amazing tool called LIDAR can help! Learn more in this video.

NASA NIMBUS: Recovering the Past
0 Views0 Comments0 Likes
50 years ago, NASA launched Nimbus to study Earth from space. Now, experts at the National Snow and Ice Data Center (part of CIRES), are recovering valuable data and images from old, long-lost film, and expanding their understanding of sea ice in the Arctic and Antarctic. Learn more from CIRES on the 1-year anniversary of Nimbus' first image:
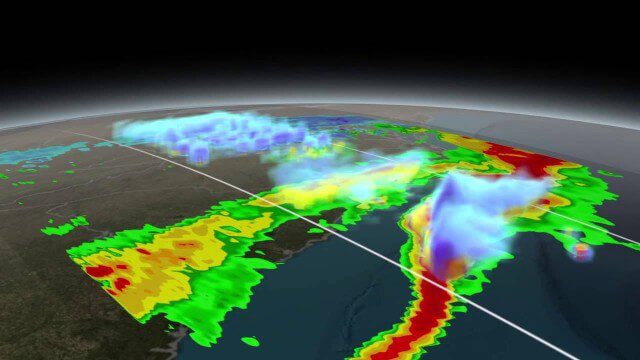
NASA Scanning a Snow Storm
0 Views0 Comments0 Likes
On March 17, 2014, the Global Precipitation Measurement (GPM) mission's Core Observatory flew over the East coast's last snow storm of the 2013-2014 winter season.
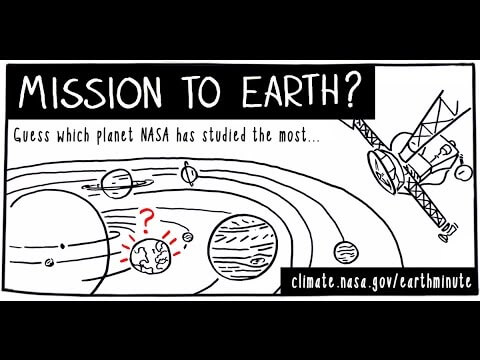
NASA’s Earth Minute: Mission to Earth?
0 Views0 Comments0 Likes
NASA doesn't just explore outer space! Since 1959, with the launch of the first weather satellite, NASA has been studying our home planet on a global scale. NASA monitors Earth's vital signs via satellites and airplanes, sends scientists to the far corners of the land and under the ocean, and develops computer models of Earth's climate processes. Why? Because Earth is the only planet that nearly eight billion people call "home sweet home."


The Global Sensor Network – University of South Australia
0 Views0 Comments0 Likes
Australia has a combined land and sea territory of more than 8 million square kilometers. Yet most of this is currently out of the reach of affordable communication. Now the University of South Australia's Institute for Telecommunications Research has turned this on its head, with the development of the Global Sensor Network. The Global Sensor Network is an innovative signal processing system which provides low cost, two-way, simultaeneous satellite communications to multiple users.
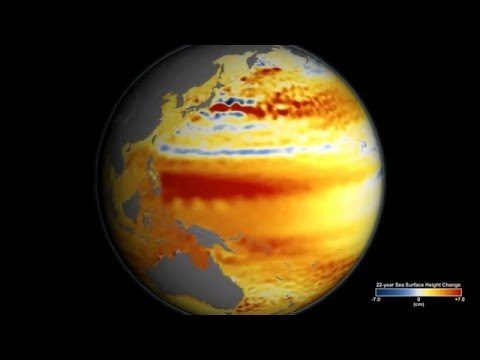
TOPEX/JASON Sees 22-Year Sea Level Rise
0 Views0 Comments0 Likes
This visualization shows total sea level change between 1992 and 2014, based on data collected from the TOPEX/Poseidon, Jason-1, and Jason-2 satellites. Blue regions are where sea level has gone down, and orange/red regions are where sea level has gone up. Since 1992, seas around the world have risen an average of nearly 3 inches. The color range for this visualization is -7 cm to +7 cm (-2.76 inches to +2.76 inches), though measured data extends above and below 7cm(2.76 inches). This particular range was chosen to highlight variations in sea level change. Download the visualization: http://svs.gsfc.nasa.gov/cgi-bin/deta....
Tracking California Rains During El Niño
0 Views0 Comments0 Likes
This winter, areas across the globe experienced a shift in rain patterns due to the natural weather phenomenon known as El Niño. New NASA visualizations of rainfall data show the various changes to California. According to the National Oceanic and Atmospheric Administration, El Niño was expected to produce wetter-than-average conditions from December 2015 to February 2016. Scientists refer to historical weather patterns and to look at trends of where precipitation normally occurs during El Niño events. Also, several factors—not just El Niño—can contribute to unusual weather pattern.

Unleashing the Power of Earth Observations
0 Views0 Comments0 Likes
What do we see when we look at the Earth, and what do these observations mean for the years ahead? Barbara Ryan, secretariat director of the Intergovernmental Group on Earth Observations (GEO), discusses this Geneva-based, voluntary partnership of governments and organizations dedicated to coordinated, comprehensive, and sustained Earth observations and information — sharing what scientific observers worldwide are learning about the state and health of planet Earth.