
Monthly Archives: March 2016
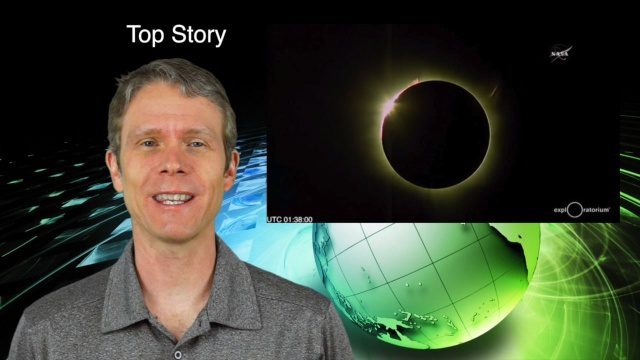
3_10 Asia Pacific Broadcast (Solar Eclipse, Groundwater Monitoring and More)
0 Views0 Comments0 Likes
This Asia-Pacific-themed GeoSpatial Stream broadcast discusses the recent solar eclipse across Indonesia and Micronesia; Japanese Universities collaborating to help build The Philippines' first microsatellite; satellite data monitoring groundwater in Pakistan; Tropical Cyclone Winston observed over Fiji; industry news from Baidu, IndoorAtlas, Yahoo! Japan, Supergeo, and German and Japanese space agencies; a video showing the excitement of a full solar eclipse; and more.
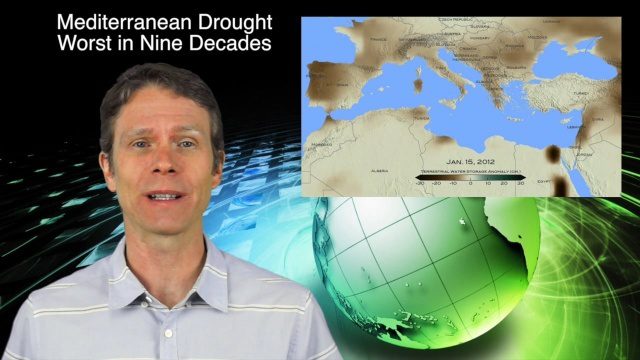
3_24 Climate Change Broadcast (Forest Recovery, Drought and More)
0 Views0 Comments0 Likes
This GeoSpatial Stream broadcast discusses several aspects of climate change, including how forests help regulate the environment and two studies that indicate recent regrowth; a USGS-led working group on ecological drought; surprisingly high levels of a banned ozone-depleting chemical; the largest Mediterranean drought in 900 years; industry news from TerraGo, Mapillary and Esri; a NASA video of one of its forest-monitoring projects; and more.

Conservation Planning in the Face of Climate Change
0 Views0 Comments0 Likes
The V1 Video team interviewed Sam Veloz, Climate Adaptation Group Director for Point Blue Conservation Science. He discussed several items related to monitoring the environment, including finding the proper scale, how the world and its sensing is changing, scenario planning, and his progress report for environmental monitoring and its successes and failures.
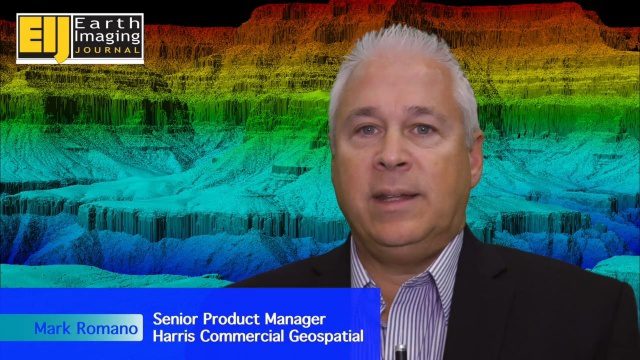
Harris Geospatial’s Geiger-Mode LiDAR Changing Industry
0 Views0 Comments0 Likes
The V1 Video team spoke with Mark Romano, Senior Product Manager, Harris Commercial Geospatial, at the ILMF 2016 event held in Denver in February 2016. He spoke about the major differences between traditional LiDAR and Geiger-Mode LiDAR acquisition and data, Harris acquiring Exelis, and the new types of customers and projects that Geiger-Mode LiDAR allows.
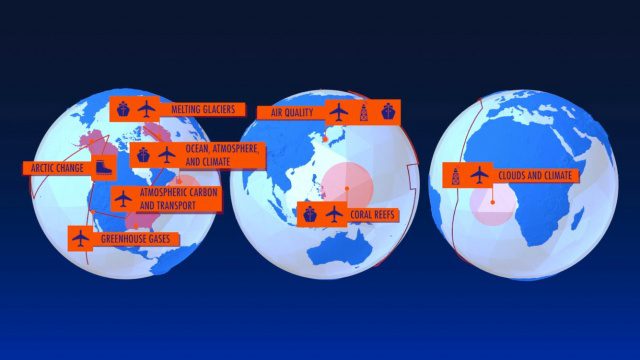
NASA Earth Expeditions: An Animated Tour
0 Views0 Comments0 Likes
NASA takes you on a world tour with this animation as we kick off major new field campaigns to study regions of critical change from land, sea and air.
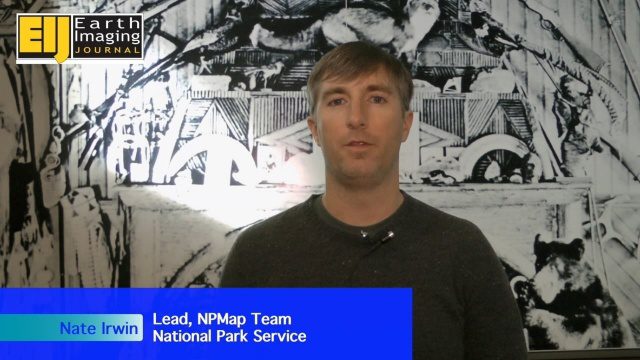
NPMap Pioneers Open and Flexible Platform
0 Views0 Comments0 Likes
The V1 Video team interviewed Nate Irwin, head of the NPMap team for the National Park Service, at the USFWS/USNPS Geospatial Training Workshop. NPMap is an innovative online mapping platform that helps park visitors navigate the details of national parks as well as providing a platform for parks to customize and share maps for park management.

PEACE on Earth GPS Art
0 Views0 Comments0 Likes
I traveled over 65,700 miles to meet people from all around the world to help me create a GPS drawing that would express a simple message. This is my journey.

Profile Soil Solutions Software (PS3) Explained
0 Views0 Comments0 Likes
The V1 Video team spoke with Matthew Welch, Technical Manager, Profile Products, at the International Erosion Control Association (IECA) Environmental Connection 2016 event held in San Antonio in February 2016. He explained the five key components of a PS3 implementation, the importance of having quality scientific data, value engineering and more.
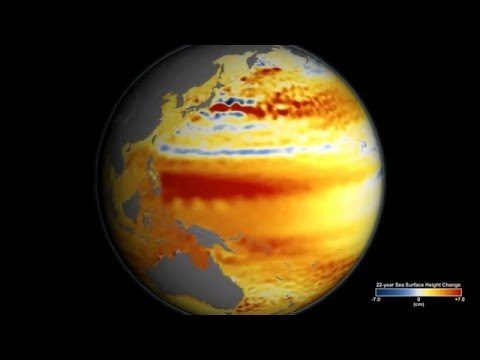
TOPEX/JASON Sees 22-Year Sea Level Rise
0 Views0 Comments0 Likes
This visualization shows total sea level change between 1992 and 2014, based on data collected from the TOPEX/Poseidon, Jason-1, and Jason-2 satellites. Blue regions are where sea level has gone down, and orange/red regions are where sea level has gone up. Since 1992, seas around the world have risen an average of nearly 3 inches. The color range for this visualization is -7 cm to +7 cm (-2.76 inches to +2.76 inches), though measured data extends above and below 7cm(2.76 inches). This particular range was chosen to highlight variations in sea level change. Download the visualization: http://svs.gsfc.nasa.gov/cgi-bin/deta....
Tracking California Rains During El Niño
0 Views0 Comments0 Likes
This winter, areas across the globe experienced a shift in rain patterns due to the natural weather phenomenon known as El Niño. New NASA visualizations of rainfall data show the various changes to California. According to the National Oceanic and Atmospheric Administration, El Niño was expected to produce wetter-than-average conditions from December 2015 to February 2016. Scientists refer to historical weather patterns and to look at trends of where precipitation normally occurs during El Niño events. Also, several factors—not just El Niño—can contribute to unusual weather pattern.