
Tag: video
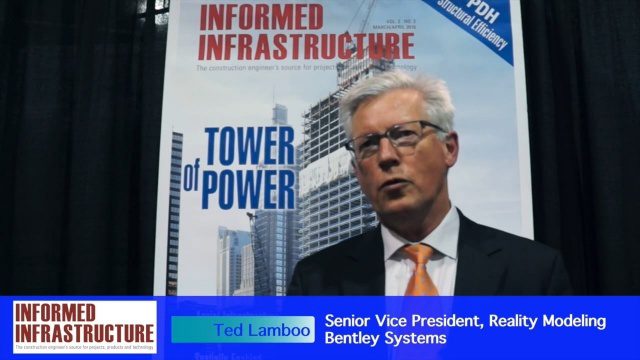
Working from Reality Capture to Modeling to Consumption
3.61K Views0 Comments0 Likes
The V1 Video team interviewed Ted Lamboo, Senior Vice President of Reality Modeling for Bentley Systems, at the 2016 SPAR 3D Expo and Conference, held April 11-14 in The Woodlands, Texas. He discusses reality modeling and the full cycle from capture to modeling to consumption, Bentley products used in that cycle such as ContextCapture, and examples of such use in highway design and substation modeling.
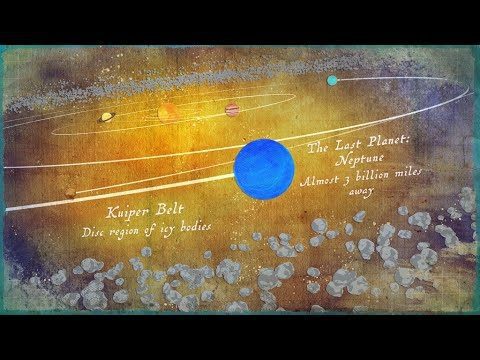
Where Is the Edge of the Solar System?
5.05K Views0 Comments0 Likes
Where does the solar system end? It all depends on the criteria you are using.
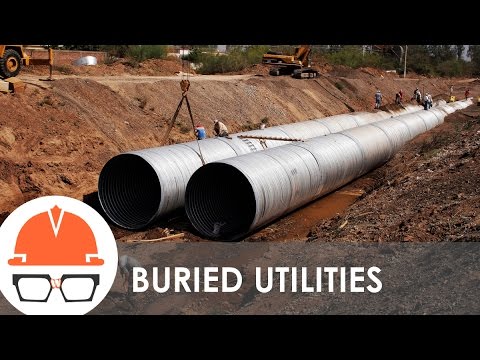
What’s that Infrastructure? (Subsurface Utilities)
1.23K Views0 Comments0 Likes
You never know what's buried below your feet, but it could be infrastructure. Today's episode of WTI shows a number of subsurface utilities.
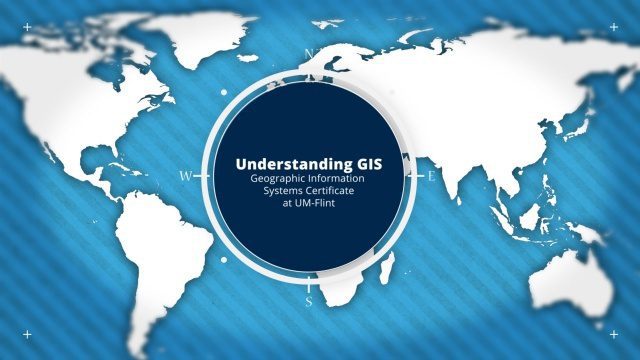
Understanding GIS – An Overview
1.55K Views0 Comments0 Likes
Geographic Information Systems are used by professionals and academics all over the world to investigate problems ranging from the spread of disease to the damage caused by hurricanes. Learn more about the University of Michigan-Flint's GIS Certificate by visiting umflint.edu/gis/gis-center

Ultra High Definition (4K) View of Planet Earth
5.47K Views0 Comments0 Likes
NASA monitors Earth's vital signs from land, air and space with a fleet of satellites and ambitious airborne and ground-based observation campaigns.
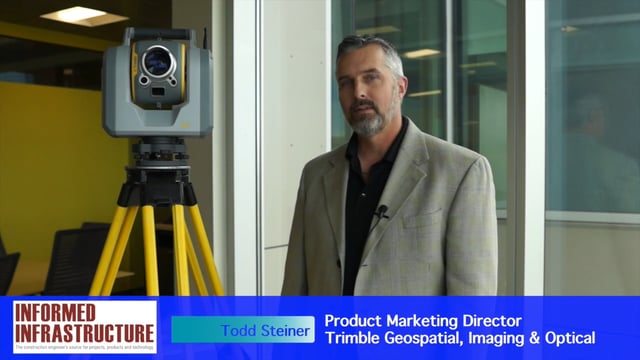
Trimble SX10 Scanning Total Station Brings “Both Worlds” to Surveyors
4.10K Views0 Comments0 Likes
Informed Infrastructure and V1 Media interviewed Todd Steiner, Product Marketing Director, Trimble Geospatial, Imaging & Optical Division, at the corporate launch of the company's new SX10 scanning total station. He discussed how combining a laser scanner with a total station is expected to be a "game changer" for surveyors who will no longer need to decide on one or the other technology before heading to the field.
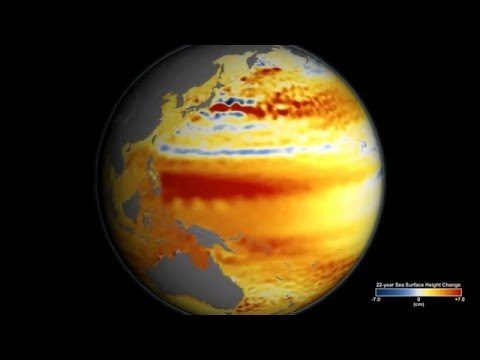
TOPEX/JASON Sees 22-Year Sea Level Rise
1.45K Views0 Comments0 Likes
This visualization shows total sea level change between 1992 and 2014, based on data collected from the TOPEX/Poseidon, Jason-1, and Jason-2 satellites. Blue regions are where sea level has gone down, and orange/red regions are where sea level has gone up. Since 1992, seas around the world have risen an average of nearly 3 inches. The color range for this visualization is -7 cm to +7 cm (-2.76 inches to +2.76 inches), though measured data extends above and below 7cm(2.76 inches). This particular range was chosen to highlight variations in sea level change. Download the visualization: http://svs.gsfc.nasa.gov/cgi-bin/deta....
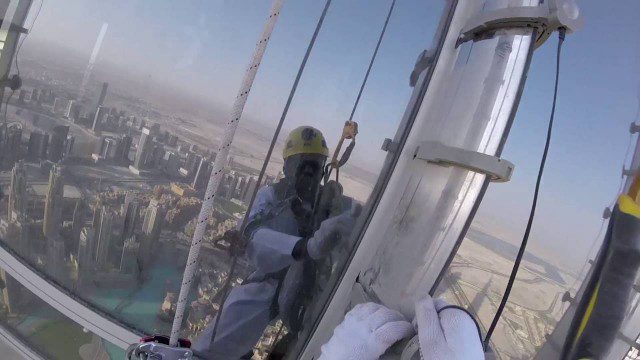
The LED Exterior Facade of Burj Khalifa Uncovered
1.50K Views0 Comments0 Likes
Facts uncovered by a dedicated team of specialized engineers. All you need to know about the largest LED screen in the world covering the world's tallest tower's facade.
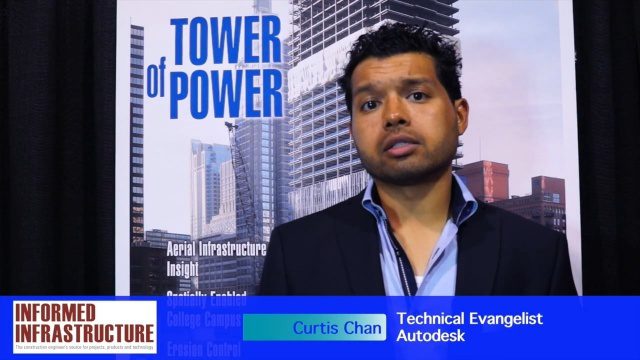
The Future of Making Things at Autodesk and Industrywide
3.00K Views0 Comments0 Likes
The V1 Video team interviewed Curtis Chan, Technical Evangelist at Autodesk, at the 2016 SPAR 3D Expo and Conference, held April 11-14 in The Woodlands, Texas. A keynote speaker at the event, he discusses "the future of making things" at Autodesk and through the industry; Autodesk's creative platforms such as Fusion, Spark and Forge; interesting use cases that have caught his attention; and how 3D printing can be scaled up into construction projects.
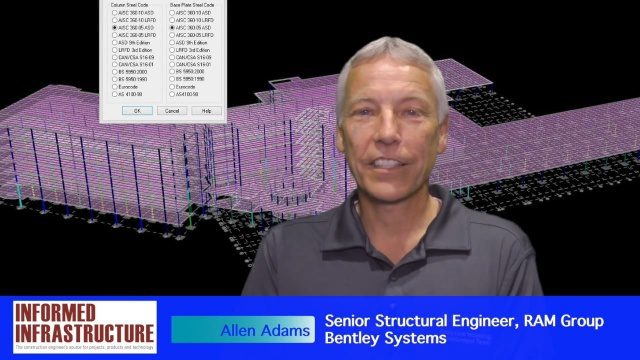
The Challenges and Benefits of Interoperability
4.78K Views0 Comments0 Likes
The V1 Video team interviewed Allen Adams, Senior Structural Engineer, RAM Group, Bentley Systems, at the 2016 NASCC: The Steel Conference, held April 13-15 in Orlando, Fla. He discusses the major challenges of interoperability in the infrastructure industry, Bentley Systems' approach to these difficulties, what it looks like when data isn't open to others within an organization, and how Bentley software saves its clients time and money.