


Category: Found on the Internet
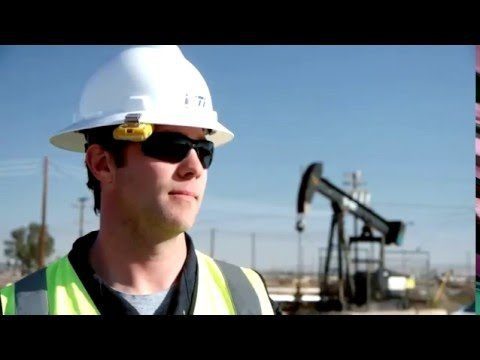
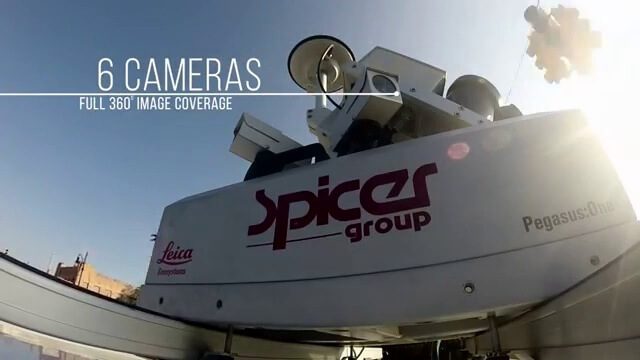
Unmanned Flights Take to San Joaquin Valley Skies
1.34K Views0 Comments0 Likes
In the San Joaquin Valley, Chevron launched unmanned aerial systems above its Coalinga Field to capture high-resolution and thermal imagery as part of a pilot project to incorporate the technology in its day-to-day field operations.
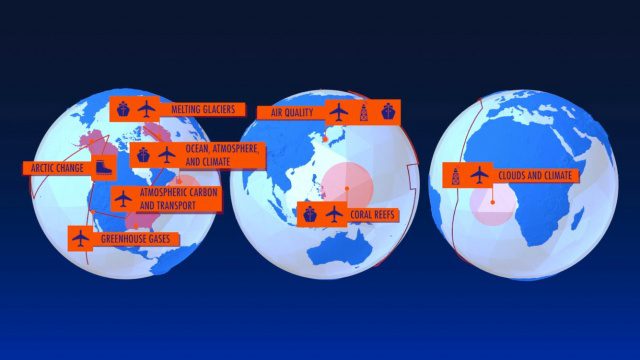
NASA Earth Expeditions: An Animated Tour
2.08K Views0 Comments0 Likes
NASA takes you on a world tour with this animation as we kick off major new field campaigns to study regions of critical change from land, sea and air.
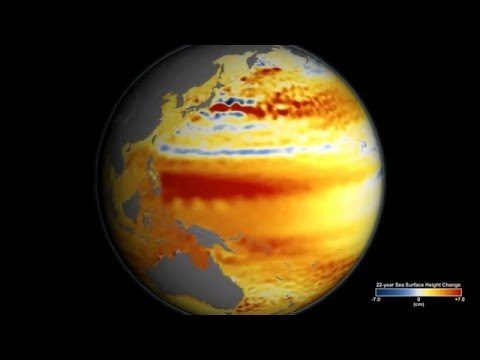
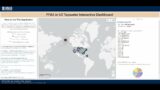
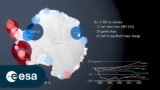
TOPEX/JASON Sees 22-Year Sea Level Rise
1.45K Views0 Comments0 Likes
This visualization shows total sea level change between 1992 and 2014, based on data collected from the TOPEX/Poseidon, Jason-1, and Jason-2 satellites. Blue regions are where sea level has gone down, and orange/red regions are where sea level has gone up. Since 1992, seas around the world have risen an average of nearly 3 inches. The color range for this visualization is -7 cm to +7 cm (-2.76 inches to +2.76 inches), though measured data extends above and below 7cm(2.76 inches). This particular range was chosen to highlight variations in sea level change. Download the visualization: http://svs.gsfc.nasa.gov/cgi-bin/deta....
Tracking California Rains During El Niño
1.38K Views0 Comments0 Likes
This winter, areas across the globe experienced a shift in rain patterns due to the natural weather phenomenon known as El Niño. New NASA visualizations of rainfall data show the various changes to California. According to the National Oceanic and Atmospheric Administration, El Niño was expected to produce wetter-than-average conditions from December 2015 to February 2016. Scientists refer to historical weather patterns and to look at trends of where precipitation normally occurs during El Niño events. Also, several factors—not just El Niño—can contribute to unusual weather pattern.
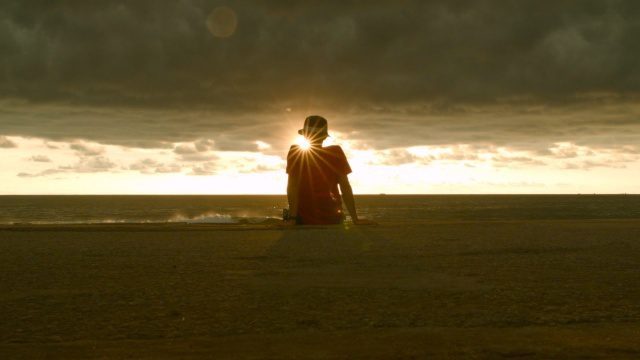
PEACE on Earth GPS Art
1.35K Views0 Comments0 Likes
I traveled over 65,700 miles to meet people from all around the world to help me create a GPS drawing that would express a simple message. This is my journey.
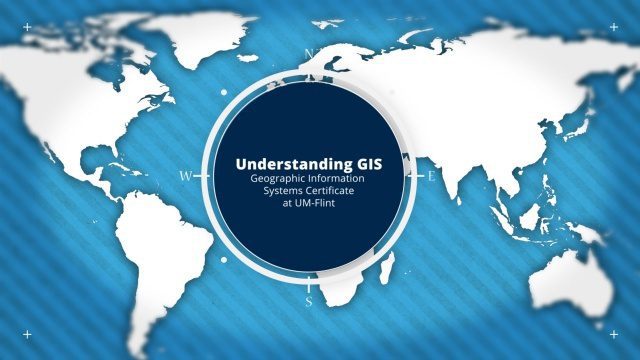
Understanding GIS – An Overview
1.55K Views0 Comments0 Likes
Geographic Information Systems are used by professionals and academics all over the world to investigate problems ranging from the spread of disease to the damage caused by hurricanes. Learn more about the University of Michigan-Flint's GIS Certificate by visiting umflint.edu/gis/gis-center

Why Attend Bentley Systems YII 2016
3.72K Views0 Comments0 Likes
This video from Bentley Systems shows highlights of the 2015 event and what attendees can expect if they convene in London in 2016.
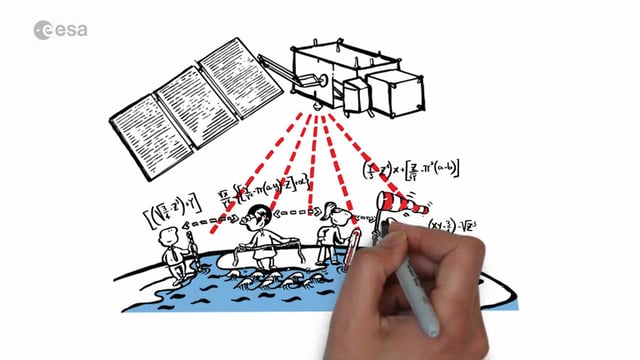
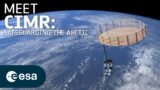
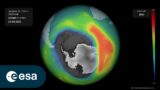
Sentinel-3 for Oceans
1.56K Views0 Comments0 Likes
In honor of the launch of Sentinel-3A on Feb. 16, 2016, here's a video about the satellite: Covering 70% of the planet, the oceans are directly linked to our weather and climate. They are also essential for global transport and provide a wealth of resources. What happens far out to sea has a direct effect on societies all over the world. Sentinel-3 provides crucial observations of our oceans, helping us to understand the overall health of our planet.
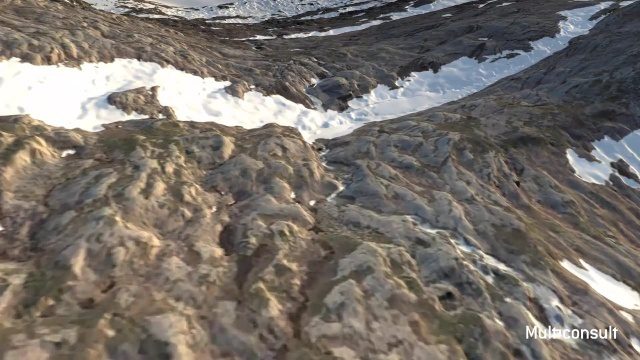
Use of InfraWorks and the Infrastructure Design Suite for a Hydropower Project in Norway
3.35K Views0 Comments0 Likes
Designing successful infrastructure projects is one thing. Communicating and demonstrating those designs to clients and other stakeholders before construction is another. Bringing a design to life for people without a civil engineering background is always a challenge, whether your goal is to sell the design or communicate its impact. - See more at: https://informedinfrastructure.com/20253/creating-real-time-navigable-3d-infrastructure-models/